Hail Season Data · DFW
When Is Hail Season In DFW?
March through June, peaking in April — with a real second season in September, October, and November that most people forget. We pulled every National Weather Service hail report for Dallas, Denton, Tarrant, and Collin counties since 2015 — 1,541 reports across 182 hail days — and the pattern is sharp: 87% of reports fall in March–June, April alone produced 39 days of inch-or-larger hail, and six in ten reports land between 5 p.m. and 11 p.m. Below: the month-by-month numbers, the record book, the time-of-day pattern, and what all of it means for where you park.
March through June, with April as the peak — 87% of all hail reports in our four-county NWS dataset fall in those four months, April alone logged 39 days of inch-plus hail since 2015, and the single busiest week of the year is the last week of May. There’s a second season too: September through November produced 21 inch-plus days. All of it from the federal storm record, not vibes.
DFW hail season runs March through June, and April is the peak month — in NWS storm reports for Dallas, Denton, Tarrant, and Collin counties from January 2015 through August 2026, 87% of all hail reports fell in those four months, and April logged 39 separate days of hail one inch or larger. The single busiest week of the year is the last week of May. There is a second season: September through November produced 21 days of inch-plus hail across the four counties in that window, including a 3-inch stone in Tarrant County in October 2019 and baseball-size hail in Denton and Dallas counties in September 2023. Timing is evening: 61% of reports arrived between 5 p.m. and 11 p.m., with 6–7 p.m. the single peak hour — the commute home and the driveway are where cars get hit. Size: one report in four was golf-ball size (1.75″) or bigger, and the record book tops out at two 5-inch stones in June 2023. The last three full years (2023, 2024, 2025) are the three heaviest in the dataset. Practical version: comprehensive coverage matters most from March 1, covered parking after 5 p.m. matters most in April and May, and the season isn’t over when school starts. Data notes at the bottom — these are point reports, not a radar map.
DFW Hail Season, Month By Month
Every row below comes from the National Weather Service Fort Worth office’s local storm reports — the hail that spotters, emergency managers, broadcasters, and the public actually reported — filtered to Dallas, Denton, Tarrant, and Collin counties, converted to local time, and counted three ways: raw reports, distinct days with any hail, and distinct days with hail of one inch or larger (the size that dents a hood). The window is January 1, 2015 through August 7, 2026.
Read the middle column and the season draws itself: March opens it, April peaks it, May and June sustain it, July shuts it off almost completely — and then September reopens a smaller door. Nothing about that is a surprise to anyone who has lived through a North Texas spring; what the numbers add is proportion. Four months carry 87% of the year’s hail reports. The other eight months share the rest — but they don’t share it evenly, which is the next section.
The Second Season Nobody Schedules For
Ask a hundred DFW drivers when hail season ends and most will say June. The data says September through November is a season of its own: 21 days of inch-plus hail across the four counties in the window, with September the busiest of the three months. It’s smaller than spring — about 7% of the year’s reports — but it lands on cars whose owners have stopped thinking about it, which is why the fall claims that come through our doors so often start with “I didn’t even know it was coming.”
Two things to notice. The fall storms hit at the same evening hours as the spring ones — and one of them, September 25, 2024, hit Frisco and Hebron at three in the morning, the kind of storm nobody moves a car for. Our storm log documents individual events as they happen; the DFW hail storm log is where the date-of-loss proof lives when a fall claim gets questioned months later.
What Time Of Day Hail Hits DFW
This is the number that changes behavior. Convert every report to Central time and the clock is lopsided: 61% of hail reports in the four counties arrived between 5 p.m. and 11 p.m., and the single busiest hour is 6–7 p.m. — 14% of the entire dataset in one hour. That is the evening commute, the school pickup line, the restaurant parking lot, and the driveway you didn’t pull into the garage because it was sunny at lunch.
The practical rule falls out of the table: in April and May, a covered spot after 5 p.m. is worth more than any other single precaution. Morning hail happens — overnight storms are real, and the 3 a.m. Frisco storm above proves it — but if you can only protect the car part of the day, protect the evening.
How Big DFW Hail Gets — The Record Book
Size distribution first, with an honest caveat: the NWS logs severe-criteria hail most reliably, so the dataset over-represents the big stuff — pea-size hail that rattles a roof and dents nothing mostly never gets reported. Among what was reported in the four counties: 81% of reports were one inch or larger, 25% were golf-ball size (1.75″) or larger, 14% were two inches or larger, and 5% were baseball size (2.75″) or larger. One report in four at golf-ball size is the number to remember: that’s the size that turns a hood into a dent count.
The week of June 11–15, 2023 owns the top of the book: 4.25-inch hail near Double Oak on the 11th, 5-inch stones in Mansfield and Cedar Hill on the 12th, and a 5-inch stone in Sanger on the 15th. Stones that size don’t dent cars — they break glass and crater roofs, and they’re why the severe end of our published hail-cost ranges reads $8,000–$15,000+, and why an older car in that path becomes a total-loss conversation.
County By County — And Year By Year
Tarrant leads on raw reports, but read that with the population caveat: more people means more reports, and the county line isn’t a weather feature — the same storm that produced Denton County’s 5-inch Sanger stone crossed into Collin County. The honest takeaway is that no metro county gets to opt out; all four log inch-plus hail on 60 to 80 separate days in the window. Our hail repair page carries the city-level tables for the thirty-eight cities and corridors we serve most.
The last three full years — 2023, 2024, and 2025 — are the three heaviest in the dataset by days of inch-plus hail. We’ll say plainly what that does and doesn’t mean: reporting has also grown over the window (more spotters, more phones, more social-media reports feeding the NWS), so an eleven-year local storm log can’t settle a climate question and we won’t pretend it does. What it can settle is planning: budget for a real hail season every year, and for a fall encore.
What The Calendar Means For Your Car
Before March 1: check the one line on your policy that decides everything — comprehensive coverage. Hail is a comprehensive claim; liability-only means no claim exists to file, and a financed car almost always carries it while a paid-off one may not. Our liability-only guide explains that gap before a storm does. And a single hail claim generally won’t raise your individual rate by itself — the rates guide has the honest math, including the territory-wide increases that arrive after storm years whether you file or not.
April and May: covered parking after 5 p.m. is the whole game. When a storm does hit, note the date and time — the storm log and the NWS reports above are how a date of loss gets proven when a claim is questioned. After a storm: get the free written estimate before you file anything; the Texas hail claim guide walks the steps, and the door-knocking “hail specialists” who follow every big storm are precisely the claims that draw carrier scrutiny — a written estimate from a shop that will still be here in March is the cheapest insurance you can buy. September: don’t put the car cover away. The second season is real, it hits at dinnertime, and its stones have reached three inches. The September 21, 2025 storm is the worked example: hen-egg hail in Collin County before sunset, a 72 mph gust overnight, and a Monday commute past flooded roads.
Where The Numbers Come From (And What They Can’t Tell You)
Source: National Weather Service Fort Worth (FWD) local storm reports, pulled from the Iowa State University Iowa Environmental Mesonet archive — every FWD report from January 1, 2015 through August 7, 2026, filtered to hail, then to Dallas, Denton, Tarrant, and Collin counties (1,541 reports). Times are converted from UTC to Central time with a standard daylight-saving rule, so an evening storm lands on the local date people remember, not the UTC date. “Hail days” count distinct local dates with at least one report; “1″+ days” count dates whose largest report was one inch or more. What the data is not: it isn’t a radar map. A report is a point where someone saw hail and told the NWS; a street with no spotter can be hit and never appear, and a busy suburb can generate ten reports from one storm. Sizes are as reported — some measured, some estimated, a few timed by radar. 2026 is a partial year. We publish the counts because they’re the best public record that exists, and we say what they can’t do because that’s the only honest way to publish them. Nothing here is insurance or legal advice.
From Our Floor
WHAT A SEASON LOOKS LIKE UP CLOSE
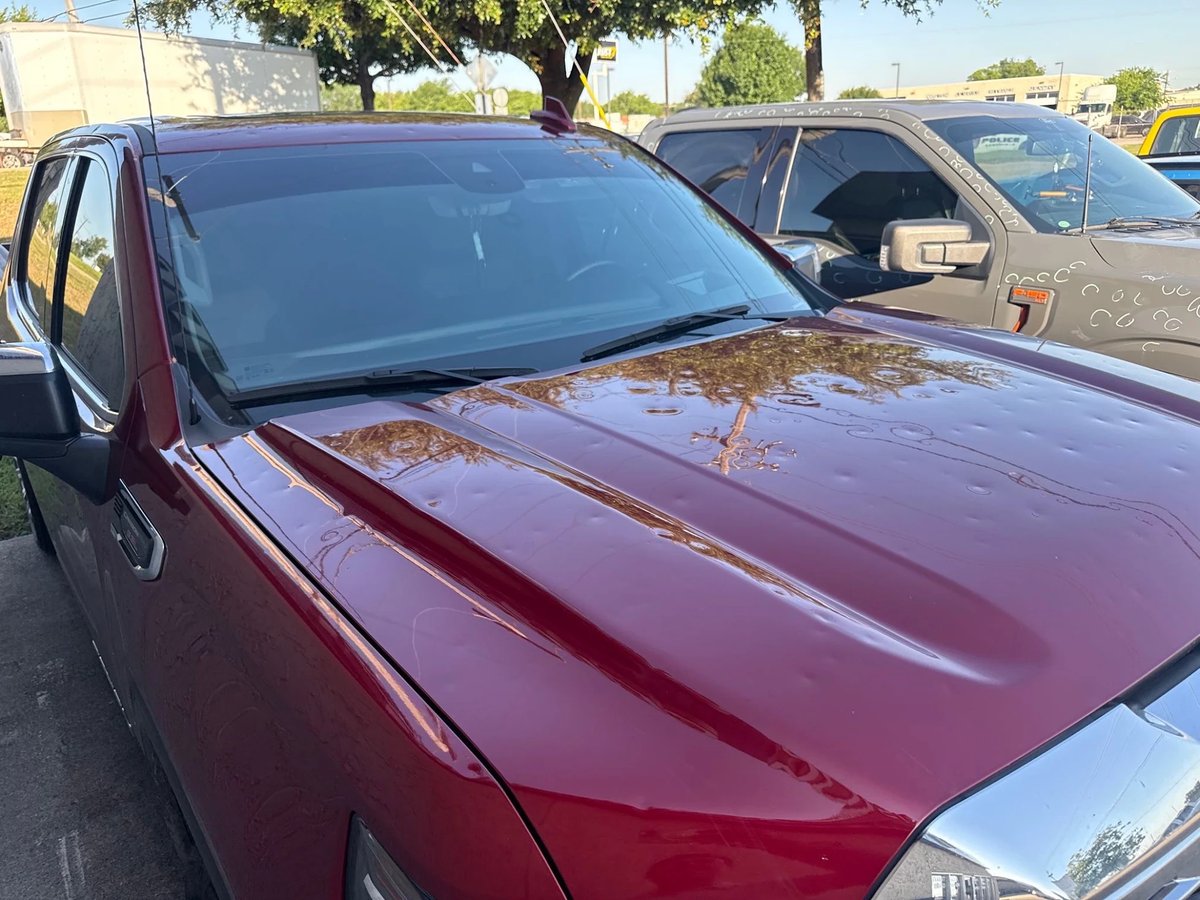
Drag the slider — a full-truck hail repair from our Lewisville floor: counted under the lights, metal-finished, delivered.

 Before
After
Before
After
Full-Vehicle Hail — A Spring Storm’s Work
Pictured: a customer’s GMC Sierra Denali — hail across the truck, counted panel by panel under PDR lights and repaired without repaint; the everyday result of an April evening in the numbers above
Storm Came Through? Get The Count Before You File.
Text photos of the dents and you get an honest read — whether the damage clears your deductible, whether PDR will handle it, and what the published ranges say — before anything touches your claim history. Free, in writing, from a shop that’s counted DFW hail since 1978.
Common Questions
DFW HAIL SEASON FAQ
Data: National Weather Service Fort Worth local storm reports via the Iowa Environmental Mesonet archive, January 1, 2015 – August 7, 2026, hail reports in Dallas, Denton, Tarrant, and Collin counties, converted to local time. Reports are point observations, not a complete record of every hailstone. General information — not insurance or legal advice.
Free · No Obligation
GET THE COUNT BEFORE YOU FILE
Tell us what you drive and what the storm did. We’ll come back with a written estimate — so you can make the file-or-skip call with the real number in hand.
Prefer to talk now? Call (972) 219-0864 · or text us photos